The CXL® Specification is becoming an important part of the Data Center and high-performance devices. Understanding CXL implementation is key to providing enhanced performance to system architecture. A CXL device is designed according to a rigorous set of specifications, but undetected errors and inefficiencies can still arise. How do errors escape detection? Often, it is due to insufficient data analysis…or simply not knowing where to look.
In this blog, we examine a trace from a prototype CXL device tested in the VIAVI Solutions lab. The trace involved running Memory Reads and Writes at varying workloads. To begin, we aimed to analyze the exchange statistics/timings based on specified workloads and traffic patterns.
Example CXL Transaction/Exchange
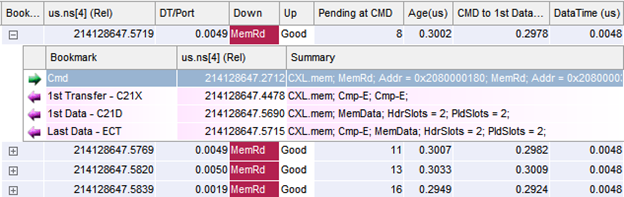
Here, we observe the details of a single CXL exchange in Xgig® TraceView. The Exchange Completion Time (ECT) represents the duration of the exchange. The Command to First Data (C21D) indicates a particularly important latency: the time to fetch the data. The Data Time (DTime) is the time from the first to last data frame, another very important measurement. Pending at Cmd (PendStart) represents the outstanding workload when the command was issued.
This view provides information that may prompt further exploration of this data. The following tables and graph represent all transactions from the trace, summarized to provide a distinct perspective. Analyzing the data in this manner results in intriguing observations.
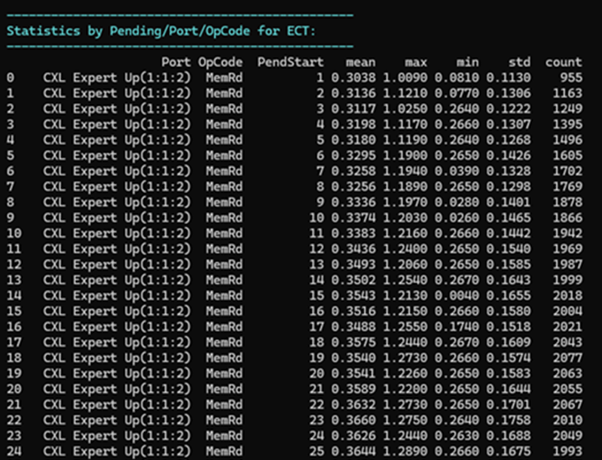
Statistics by Pending/Port/OpCode for ECT
Initially, we see a strong correlation between the ECT and the number of outstanding tasks (or PendStart). The workload affects the time required for a single CXL transaction to complete. Balancing workloads is a critical task, as devices commonly have “sweet spots” where they achieve optimal performance. There may also be conditions that cause poor or erratic performance.
Examining the “Statistics by Pending/Port/OpCode for ECT” table reveals that this device maintains consistent performance across various workloads. The mean ECT for Memory Reads (MemRd) exhibits a gradual, steady increase from 1 to 24 pending exchanges, with only minimal variations in max/min values.
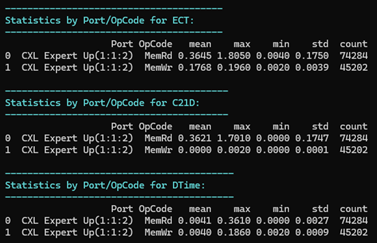
Statistics by Port/OpCode
The following tables clearly display the counts and types of commands (OpCodes) present in the data along with detailed statistics for each (specifically MemWr and MemRd). The tables are organized by phase of exchange.
It is evident that the majority of the completion time for memory read opcodes is a result of waiting for the data; and the data time is miniscule when compared to the completion time. For memory writes, the completion time depends on the timing of the response.
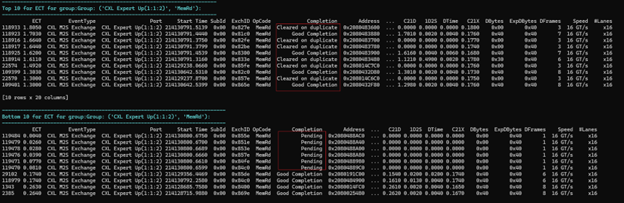
“Top and Bottom” Tables
The following table represents the Top 10 (slowest) and Bottom 10 (fastest) exchange times. In this example, six of the slowest exchanges are marked as “cleared on duplicate,” indicating that they failed and will need to be retried. They are significantly slower than normal exchange timings, which could indicate a trouble spot for the device. Pending exchanges are those that are incomplete at the end of the trace data. In this example, the pending exchanges have fast completion times. Occasionally, exchanges get “stuck” and take a long time to complete or may only complete after a reset.
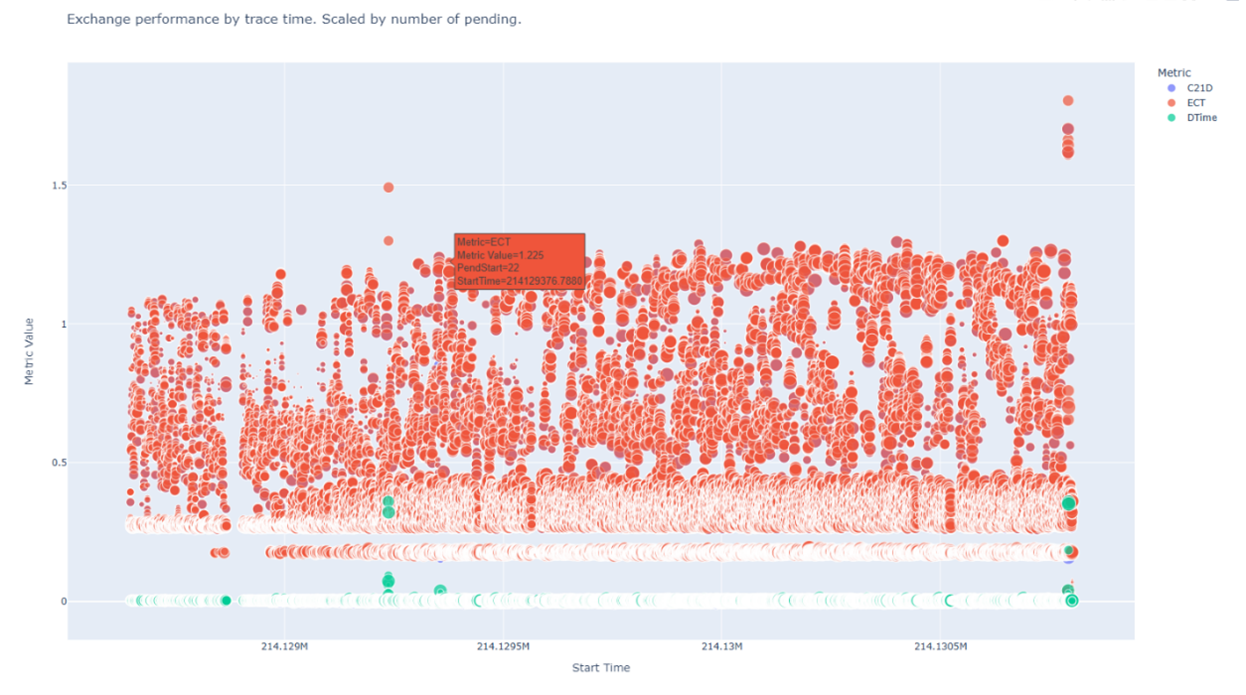
A Graphical Look at Principal Phases of a CXL Transaction
The next graph, from Xgig Serialytics, illustrates the three principal phases of a CXL transaction. In this example, the green dots (DTime) illustrate the noise floor as they should essentially be the same time for all exchanges (around 40ns for the previous example). However, visible anomalies appear, due to the retry/retransmissions occurring in the trace, highlighting the same troubles indicated in the Top Ten/Bottom Ten tables above. Visualizations and tables of data like this enhance our ability to expose the hidden behaviors of devices.
Conclusion
We all want to ensure that our products perform according to the published specifications. These examples illustrate the importance of increased visibility and analysis of the CXL workload of exposing problems that may escape detection initially, but lead to subpar product performance when deployed. Combining high-level diagnostics with the ability to identify patterns and delve deeply into the data helps bring product designs to market quickly and with confidence.
About the Author
Steve Klotz is a Principal Engineer and Protocol Evangelist for VIAVI Solutions. He specializes in analyzing data traces and developing Xgig software to uncover trends, relationships, and anomalies, enabling users to gain deeper insight into their devices.